Sample Analysis 2: Videogame Sales Dataset
Objectives
I had two objectives while mining this dataset. The first was to visualize and present game sale, region, and platform data platform to see what novel observations could be made. The second was to gauge the relationship of sales and game reviews by attempting to establish a predictive model for sales using linear regression with review scores.
Dataset Download »
Using this python script » the plot below was generated showing total sales per console in a region specific manner.
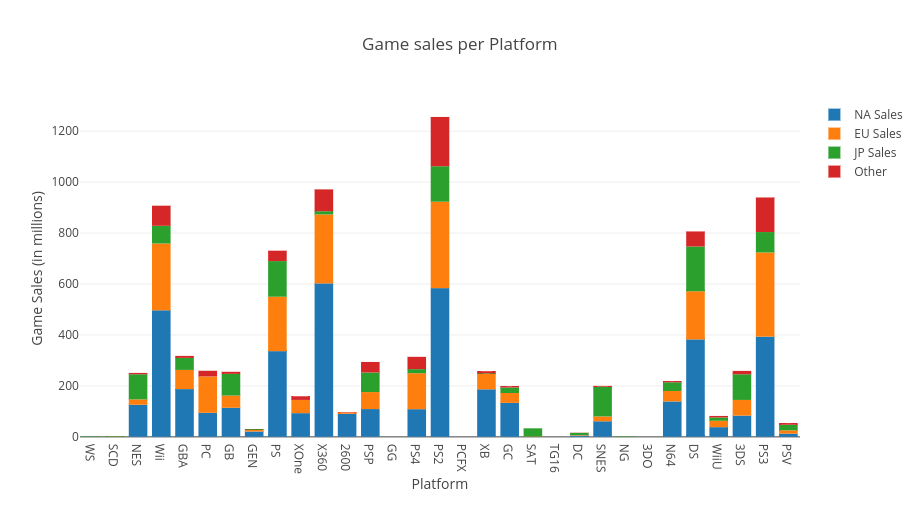 Interactable versions of all plots are available on click
Next I wanted to examine how many total games each region purchases each year. This information could be used to deduce which markets are most viable, which are growing, and which are sinking.
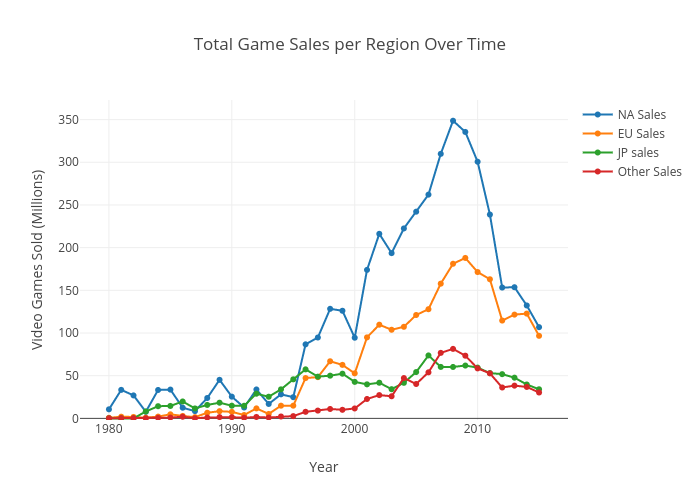
As we can see by the figures, North American audiences dominate the market, which peaked around 2008 and has since fallen significantly. Although this shows us the general trend of the market, it does not give much information on the viability between markets as the regional groups vary greatly in population size.
Using the United Nations Population Division Website I prepared this csv file with relevant population info spanning the time period of interest to normalize the data relative to population size.
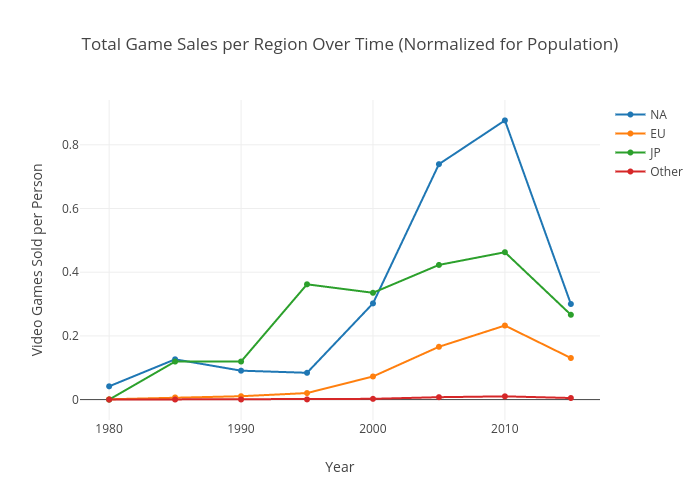
We now see some very different results, with Japan being much closer to North American markets, and Europe having a smaller market density.
Looking at genre statistics could reveal some interesting insight on what kind of games are popular where. (and vice versa). I'll first try to take a look at simply what is most popular in each region.
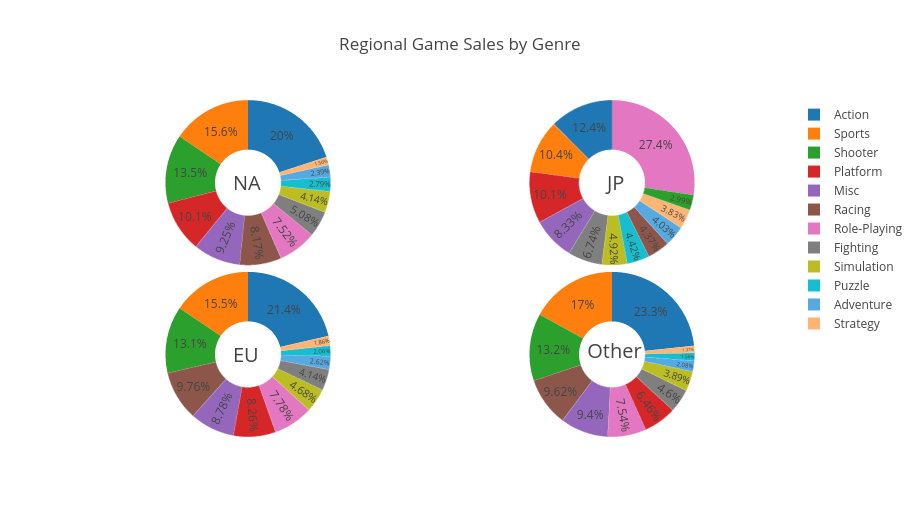
Sports and Action Games hold the #1 and 2 spot for each region except for Japan, where RPGS are over double the second highest genre (Action). RPGs however, do not even hold a top 5 position in any other area.
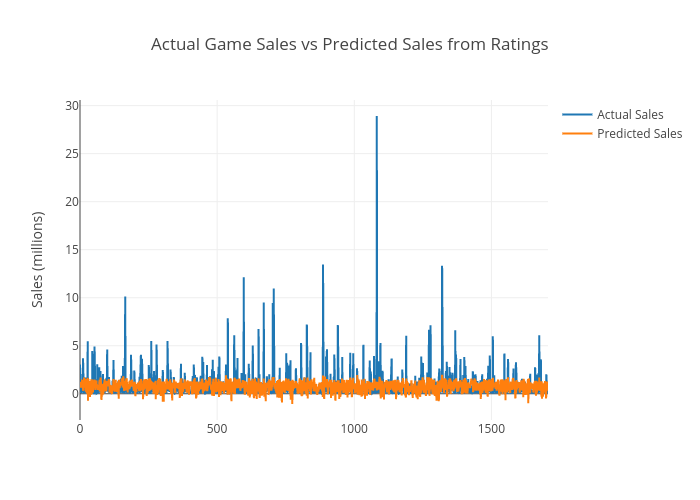
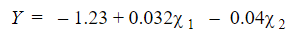
The predictive algorithm and chart below were developed in this script. Uses 75% of the dataset (randomly selected) as the training set and the rest as validation.
User_Score Coefficient = -0.0390726846176
Intercept = -1.230921908642375
Model:
R squared value: 0.080099583123
Mean square Error: 3.08043696032
So 8% of the variability of sales could be explained by review scores. The average offset of sales prediction from this model 1.755117363687328 (million).